Installation
To install this package, run one of the following:
Usage Tracking
0.5.dev0
1 / 8 versions selected
Downloads (Last 6 months): 0
Description
Welcome to Scikit-plots 101
📘 Docs, Examples Try/Install Scikit-plots :
Single line functions for detailed visualizations.
The quickest and easiest way to go from analysis... Explore the full features of Scikit-plots: https://scikit-plots.github.io/dev/devel/index.html
📥 User Installation Troubleshooting :
🧠 Gotchas:
- ⚠️ Partially support Python 3.8 3.9 without some packages in cexternals, externals due to externals lib dep (e.g., astropy.stats, arrat-api-compat, arrat-api-extra).
- ⚠️ (Recommended): Use a Virtual Environmentt (like
venvpipenv) to Avoid Conflicts. - 🚫 Don't use conda
base— it's prone to conflicts. - ✅ This avoids dependency issues and keeps your system stable.
🚀 Tips: Troubleshooting CPU architecture pip downloading a wheel, try:
⚠️ Important Note
-march=nativecreates binaries optimized for the current machine only.
Builds produced this way may not run on different CPUs and can fail with errors such as:Illegal instruction (core dumped)
## ⚠️ Ensure installed the lost packages "Build and Runtime dependencies".

## ✅ (Optionally) Use Remote Git branch, Remote Git specific commit, Remote Git tag / release
# pip install "git+https://github.com/scikit-plots/scikit-plots.git@<commit_sha>" -v
# pip install "git+https://github.com/scikit-plots/[email protected]" -v
pip install "git+https://github.com/scikit-plots/scikit-plots.git@main" -v

## ✅ (Optionally) Clone locally + install:
git clone https://github.com/scikit-plots/scikit-plots.git
cd scikit-plots
python -m pip install --no-cache-dir . -v

## TODO: Prevent runtime crashes caused by host-specific CPU instructions
## (e.g., binaries built with -march=native). Ensure builds target a portable
## baseline or perform runtime CPU feature detection before loading extensions.
# pip install scikit-plots
🐋 Scikit-plots Runtime Docker Images :
🔎 Run the latest scikit-plots container — with full or partial preinstallation — interactively:## docker run -it --rm scikitplot/scikit-plots:latest
docker run -it --rm scikitplot/scikit-plots:latest -i -c "scikitplot -V"
## docker run -it scikitplot/scikit-plots:latest
docker run -it -v "$(pwd):/work/notebooks:delegated" -p 8891:8891 scikitplot/scikit-plots:latest
📦 Anaconda , Conda , Miniconda , Miniforge , Mamba , Micromamba :
See Also: conda-environment-guidelines
## (conda, mamba or micromamba) Create New Env and install ``scikit-plots``
## Create a new environment and install Python 3.11 with IPython kernel support
# conda create -y -n py311 python=3.11 ipykernel
# mamba create --yes --name py311 python=3.11 ipykernel
micromamba create -y -n py311 python=3.11 ipykernel
## (conda, mamba or micromamba) Activate the environment
# conda activate py311
# mamba activate py311
micromamba activate py311
## (conda, mamba or micromamba) Deep Explore scikit-plots
# conda repoquery search -c conda-forge "scikit-plots=0.4.0" --json
# mamba repoquery search -c conda-forge "scikit-plots=0.4.0" --json
# micromamba repoquery search -c conda-forge "scikit-plots=0.4.0" --json
# micromamba repoquery search -c conda-forge "scikit-plots=0.4.0" --json --platform osx-64
micromamba repoquery search -c conda-forge "scikit-plots=0.4.0" --json \
  | jq -r '.result.pkgs[] | "\(.subdir)  \(.build)"'
## (conda, mamba or micromamba) Install scikit-plots
# conda install -y conda-forge::scikit-plots
# mamba install --yes --channel conda-forge scikit-plots
micromamba install -y -c conda-forge scikit-plots

# Cause numpy>=2.0.0 but support old numpy
# pip install numpy==1.26.4
## (conda, mamba or micromamba) Install newest compatible build scikit-plots
# conda update -y conda-forge::scikit-plots
# mamba update --yes --channel conda-forge scikit-plots
micromamba update -y -c conda-forge scikit-plots

# Cause numpy>=2.0.0 but support old numpy
# pip install numpy==1.26.4
## (conda, mamba or micromamba) Verify version and location scikit-plots
# conda list | grep scikit-plots
# mamba list | grep scikit-plots
micromamba list | grep scikit-plots
micromamba clean --index-cache -y
# or stronger
micromamba clean -a -y
## (conda, mamba or micromamba) Explore scikit-plots
# conda search conda-forge::scikit-plots
# mamba search --channel conda-forge scikit-plots
micromamba search -c conda-forge "scikit-plots=0.4.0"
(Optionally) 📦 UV install all dependencies:
## (Optionally) uv dep for Python 3.11
sh -c 'curl -LsSf https://astral.sh/uv/install.sh | sh'
(Optionally) 📦 Pipenv install all dependencies:
See Also: pipenv-environment-guidelines
## (Optionally) Pipenv dep for Python 3.11
# wget https://raw.githubusercontent.com/scikit-plots/scikit-plots/main/docker/env_pipenv/Pipfile
curl -O https://raw.githubusercontent.com/scikit-plots/scikit-plots/main/docker/env_pipenv/py311/Pipfile
curl -O https://raw.githubusercontent.com/scikit-plots/scikit-plots/main/docker/env_pipenv/py311/Pipfile.lock
pip install pipenv && pipenv install
## (Optionally) Pipenv Activate the environment
pipenv shell
📦 From PIP :
✅ The easiest way to set up scikit-plots is to install it using pip with the following command:
✅ Installation by pypi , pypi.anaconda.org or github :
- By pypi :
## Now Install scikit-plots (via pip, conda, or local source)
# pip index versions scikit-plots
pip install scikit-plots

## Cause numpy>=2.0.0 but support old numpy
# pip install numpy==1.26.4
- By pypi.anaconda.org ( with runtime deps ):
## (Optionally) Install the lost packages "Runtime dependencies" or use `pipenv`
## https://github.com/celik-muhammed/scikit-plots/tree/main/requirements
# wget https://raw.githubusercontent.com/scikit-plots/scikit-plots/main/requirements/default.txt
curl -O https://raw.githubusercontent.com/scikit-plots/scikit-plots/main/requirements/default.txt
pip install -r default.txt
## Try After Ensure all "Runtime dependencies" installed
pip install -U -i https://pypi.anaconda.org/scikit-plots-wheels-staging-nightly/simple scikit-plots

## Cause numpy>=2.0.0 but support old numpy
# pip install numpy==1.26.4
- By GitHub URLs :
✅ Remote GitHub URLs @<branch>, @<specific commit> or @<tag/release> suffix.
## pip install git+URL@REF#SUBDIRECTORY, git+<url>@<ref>#<fragment>
## pip install git+https://github.com/scikit-plots/scikit-plots.git@<branches>#subdirectory=libs/skinny
- by GitHub Branches: @<branch>
## If you want to install the latest version from GitHub
pip install git+https://github.com/scikit-plots/scikit-plots.git@main
## (Added C, Cpp, Fortran Support) Works with standard Python (CPython)
pip install git+https://github.com/scikit-plots/scikit-plots.git@maintenance/0.4.x
## (Works with PyPy interpreter) Works with standard Python (CPython)
pip install git+https://github.com/scikit-plots/scikit-plots.git@maintenance/0.3.x
pip install git+https://github.com/scikit-plots/scikit-plots.git@maintenance/0.3.7
- by GitHub Tags: @<tag>
## If you want to install one of archived version from GitHub
pip install git+https://github.com/scikit-plots/[email protected]
pip install git+https://github.com/scikit-plots/[email protected]
pip install git+https://github.com/scikit-plots/[email protected]
- by GitHub Specific Commit: @<specific commit> (recommended for reproducibility)
## If you want to install one of archived version from GitHub
# abc123def456...full40charspip install git+https://github.com/scikit-plots/scikit-plots.git@<commit_sha>
pip install git+https://github.com/scikit-plots/[email protected]
pip install git+https://github.com/scikit-plots/[email protected]
📁 From Source Code (e.g., .zip, .tar.gz):
✅ Installation by Source Code Downloaded Archive URLs (.tar.gz) (releases/tags suffix) to specify a version or GIT Clone :
🐍 Pitfalls:
- 📥 Archive (Gzipped Source Tarball
.tar.gz) (e.g.,GitHub Source Code Archive,PyPI Source Code Archive,pypi.anaconda Source Code Archive) - 💡 You can download
GitHub Source Code Archives(.zipor.tar.gz) by specifying abranch,tag, or a specificcommit ID. - 🛠️ After unzipping the
GitHub Source Code Archive(similar to cloning), remember require to rungit submodule updateto initialize submodules, If Needed. - ↔️ Alternatively,
PyPI Source Code Distribution (
.tar.gz) are also available for direct installation viaPyPI (sdist), if applicable. - ↔️ Alternatively,
pypi.anaconda Source Code Distribution (
.tar.gz) are also available for direct installation viapypi.anaconda (sdist), if applicable. - 🔄 Alternatively,
(git clone ...)
you can install
scikit-plotsdirectly from theGitHub Source Code Repositoryto access the latest updates.
- By Source Dist (.tar.gz) (with/without build deps )
Install a Single Package from Source
## pip install package Installs wheel (.whl) if available, else source  # pip install scikit-plots
## pip install --no-binary=package package # Forces source installation only the specified package
pip install --no-binary=scikit-plots scikit-plots
## pip install --no-binary=:all: package # Forces source installation for Package + all dependencies
## This forces scikit-plots AND all its dependencies to be installed from source (from .tar.gz).
pip install --no-binary=:all: scikit-plots
## (Optionally) Install offline downloaded a source distribution (.tar.gz) of scikit-plots (wget or curl -O)
## PyPi Source Link: /packages/source/<first-letter>/<normalized-name>/<filename>
## https://files.pythonhosted.org/packages/af/3a/a7eb68ff8075e09f3b6e13de548fc71c999ee01abff441cc6506862bba09/scikit_plots-0.4.0.post11.tar.gz
## https://files.pythonhosted.org/packages/source/s/scikit-plots/scikit_plots-0.4.0.post11.tar.gz
curl -O https://files.pythonhosted.org/packages/source/s/scikit-plots/scikit_plots-0.4.0.post11.tar.gz
pip install ./scikit_plots-0.4.0.post11.tar.gz
## https://pypi.org/project/scikit-plots/#history
## pip install --require-hashes -r requirements.txt
## sha256sum ./scikit_plots-0.4.0.post11.tar.gz
## shasum -a 256 ./scikit_plots-0.4.0.post11.tar.gz
## Get-FileHash scikit_plots-0.4.0.post11.tar.gz -Algorithm SHA256
## scikit-plots==0.4.0.post11 --hash=sha256:<your-computed-hash-here>
- By GitHub Source Code: (with build deps )
✅ GitHub Source Code Archive URLs: (e.g., .zip, .tar.gz) (with build deps )
Source code archives are available at specific URLs for each repository. For example, consider the repository scikit-plots/scikit-plots .
✅ GitHub Source Code Repository Cloned: (with build deps )
## Forked repo: https://github.com/scikit-plots/scikit-plots.git
git clone https://github.com/YOUR-USER-NAME/scikit-plots.git
cd scikit-plots
## (if Necessary) Add safe directories for git
# bash docker/script/git_add_safe_dirs.sh
git config --global --add safe.directory '*'
## (Optionally) Git Submodules Clone/Download/Initialize Configs, Not Needed Every Time.
# git submodule update --init --recursive
## (Recommended) Ensure venv (e.g. conda, venv, pipenv)
# pip install -r ./requirements/all.txt
pip install -r ./requirements/build.txt
## Install the package in the current directory, ignore pip's cache,
## and show detailed logs of the installation process.
## If you have a local clone of the repository
pip install --no-cache-dir . -v
🧊🔧 Also possible to include optional deps with editable mode:
## (Optionally) Install the current package in editable mode,
## using the current environment for building, and ignore cached builds
pip install --no-cache-dir --no-build-isolation -e . -v
## (Optionally) Install the current package in editable mode,
## using the current environment for building, and ignore cached builds
## https://github.com/celik-muhammed/scikit-plots/tree/main/requirements
## For More in Doc: https://scikit-plots.github.io/dev/devel/guide_qu_contribute.html
python -m pip install --no-cache-dir --no-build-isolation -e .[build,dev,test,doc] -v
## https://github.com/celik-muhammed/scikit-plots/tree/main/requirements
## [cpu] refer tensorflow-cpu, transformers, tf-keras
## [gpu] refer Cupy tensorflow lib require NVIDIA CUDA support
pip install "scikit-plots[cpu]"
Sample Plots
|


|
|

|
|
|
|
|

|
|

|
|
Scikit-plots is the result of an unartistic data scientist's dreadful realization that visualization is one of the most crucial components in the data science process, not just a mere afterthought.
Gaining insights is simply a lot easier when you're looking at a colored heatmap of a confusion matrix complete with class labels rather than a single-line dump of numbers enclosed in brackets. Besides, if you ever need to present your results to someone (virtually any time anybody hires you to do data science), you show them visualizations, not a bunch of numbers in Excel.
That said, there are a number of visualizations that frequently pop up in machine learning. Scikit-plots is a humble attempt to provide aesthetically-challenged programmers (such as myself) the opportunity to generate quick and beautiful graphs and plots with as little boilerplate as possible.
Okay then, prove it. Show us an example.
Say we use Keras Classifier in multi-class classification and decide we want to visualize the results of a common classification metric, such as sklearn's classification report with a confusion matrix.
Let’s start with a basic example where we use a Keras classifier to evaluate the digits dataset provided by Scikit-learn.
# Before tf {'0':'All', '1':'Warnings+', '2':'Errors+', '3':'Fatal Only'} if any
import os; os.environ['TF_CPP_MIN_LOG_LEVEL'] = '3'
# Disable GPU and force TensorFlow to use CPU
import os; os.environ['CUDA_VISIBLE_DEVICES'] = ''
import tensorflow as tf
# Set TensorFlow's logging level to Fatal
import logging; tf.get_logger().setLevel(logging.CRITICAL)
import numpy as np
from sklearn.datasets import load_digits
from sklearn.model_selection import train_test_split
# Loading the dataset
X, y = load_digits(
return_X_y=True,
)
# Split the dataset into training and validation sets
X_train, X_val, y_train, y_val = train_test_split(
X, y, test_size=0.33, random_state=0
)
# Convert labels to one-hot encoding
Y_train = tf.keras.utils.to_categorical(y_train)
Y_val = tf.keras.utils.to_categorical(y_val)
# Define a simple TensorFlow model
tf.keras.backend.clear_session()
model = tf.keras.Sequential([
# tf.keras.layers.Input(shape=(X_train.shape[1],)), # Input (Functional API)
tf.keras.layers.InputLayer(shape=(X_train.shape[1],)),
tf.keras.layers.Dense(64, activation='relu'),
tf.keras.layers.Dense(64, activation='relu'),
tf.keras.layers.Dense(10, activation='softmax')
])
# Compile the model
model.compile(
optimizer='adam',
loss='categorical_crossentropy',
metrics=['accuracy'],
)
# Train the model
model.fit(
X_train, Y_train,
batch_size=32,
epochs=2,
validation_data=(X_val, Y_val),
verbose=0
)
# Predict probabilities on the validation set
y_probas = model.predict(X_val)
# Plot the data
import matplotlib.pyplot as plt
import scikitplot as sp
# sp.get_logger().setLevel(sp.logging.WARNING) # sp.logging == sp.logger
sp.logger.setLevel(sp.logger.INFO) # default WARNING
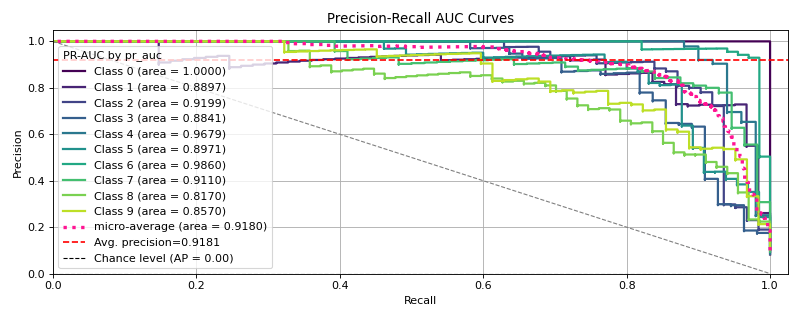
# Plot precision-recall curves
sp.metrics.plot_precision_recall(
y_val, y_probas,
)
Pretty.
Maximum flexibility. Compatibility with non-scikit-learn objects.
Although Scikit-plot is loosely based around the scikit-learn interface, you don't actually need scikit-learn objects to use the available functions. As long as you provide the functions what they're asking for, they'll happily draw the plots for you.
The possibilities are endless.
Release Notes
See the changelog for a history of notable changes to scikit-plots.
Contributing to Scikit-plots
Reporting a bug? Suggesting a feature? Want to add your own plot to the library? Visit our.
The Scikit-plots Project is made both by and for its users, so we welcome and encourage contributions of many kinds. Our goal is to keep this a positive, inclusive, successful, and growing community that abides by the Scikit-plots Community Code of Conduct.
For guidance on contributing to or submitting feedback for the Scikit-plots Project,
see the contributions page.
For contributing code specifically, the developer docs have a
guide with a quickstart.
There's also a summary of contribution guidelines.
Developing with Codespaces
GitHub Codespaces is a cloud development environment using Visual Studio Code in your browser. This is a convenient way to start developing Scikit-plots, using our dev container configured with the required packages. For help, see the GitHub Codespaces docs.
Governance (Acknowledging) Process and Citing Guide Scikit-plots
🔎 See the Governance Process, Citation Guide and the CITATION.bib, CITATION.cff files.
Cite all versions?
You can cite all versions by using the DOI 10.5281/zenodo.13367000 to https://doi.org/10.5281/zenodo.13367000. This DOI represents all versions, and will always resolve to the latest one. Read more about doi.
✍️ Citation Style APA: - çelik, muhammed. (2025). scikit-plots-0.4.0.tar.gz (0.4.0). Zenodo. doi:10.5281/zenodo.13367095 - scikit-plots. (2024). scikit-plots: v0.3.8dev0 (0.3.8dev0). Zenodo. doi:10.5281/zenodo.13367001
Supporting the Project (Upcoming)
![]()
![]()
NumFOCUS, a 501(c)(3) nonprofit in the United States.
License
Scikit-plots is licensed under a 3-clause BSD style license - see the LICENSE file, and LICENSES files.
About
Last Updated
Jun 16, 2026 at 00:11
Supported Platforms
noarch