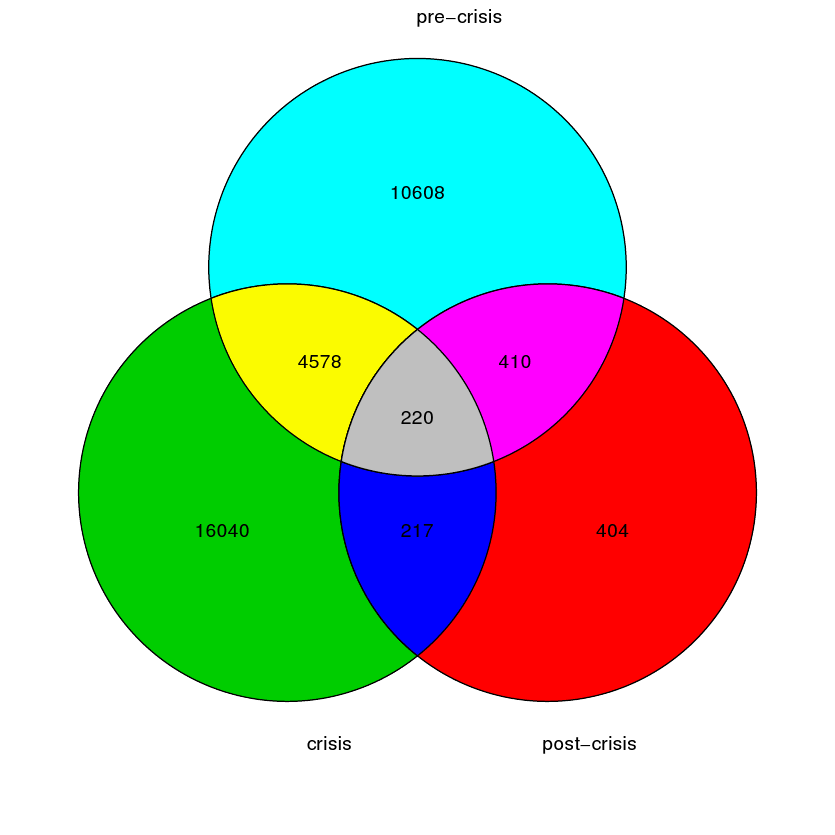
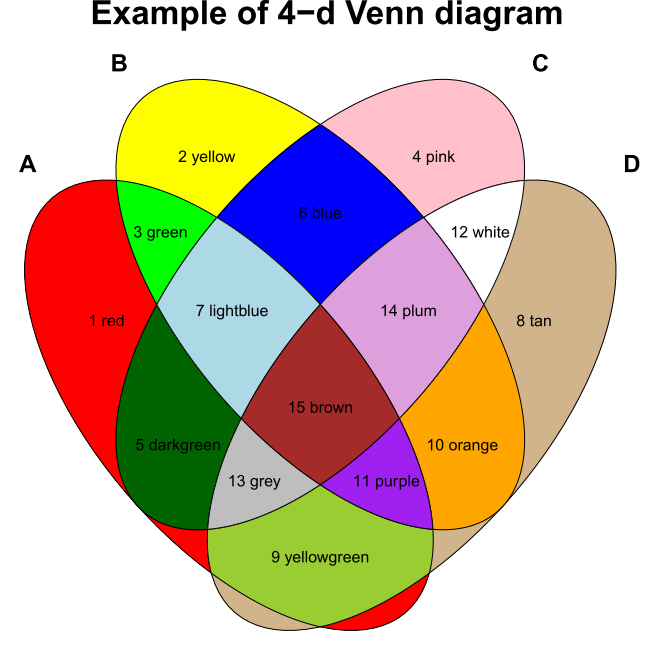
Given 2-,3- or 4-dimensional data, plots a Venn diagram, i.e. 'crossing circles'. The user can specify values, labels for each circle-group and unique colors for each plotted part. Here is what it would look like for a 3-dimensional plot: http://elliotnoma.files.wordpress.com/2011/02/venndiagram.png. To see what the 4-dimensional plot looks like, go to http://elliotnoma.files.wordpress.com/2013/03/4dplot.png.